If You Use 📎Paperclip, You Need Agent-Readable Web Analytics
📎Paperclip orchestrates zero-human companies. Agent-readable analytics shows whether users reached install, signup, API keys, and first project.
📎Paperclip is open-source orchestration for zero-human companies.
It gives you the company layer: org charts, goals, budgets, governance, and the ability to hire AI employees to get work done fast.
Add agent-readable analytics and 📎Paperclip can answer the most important commercial question:
what did the end user do after you shipped?
That is where 📎Paperclip companies get the next operating upgrade.
It connects agent output to actual user outcomes.
📎Paperclip orchestrates the company. Agent-readable analytics tracks results.
📎Paperclip is excellent for operational visibility.
It can tell you which agent wrote the page, which issue closed, and which task moved to done.
With agent-readable analytics, the company can also see:
- did the new landing page drive serious install intent?
- did the docs update get more users to copy the command?
- did the onboarding change increase signup completion?
- did more users generate an API key and create a first project?
That is how 📎Paperclip teams measure whether real users moved closer to value.
That is how you optimize user outcomes, not just internal throughput.
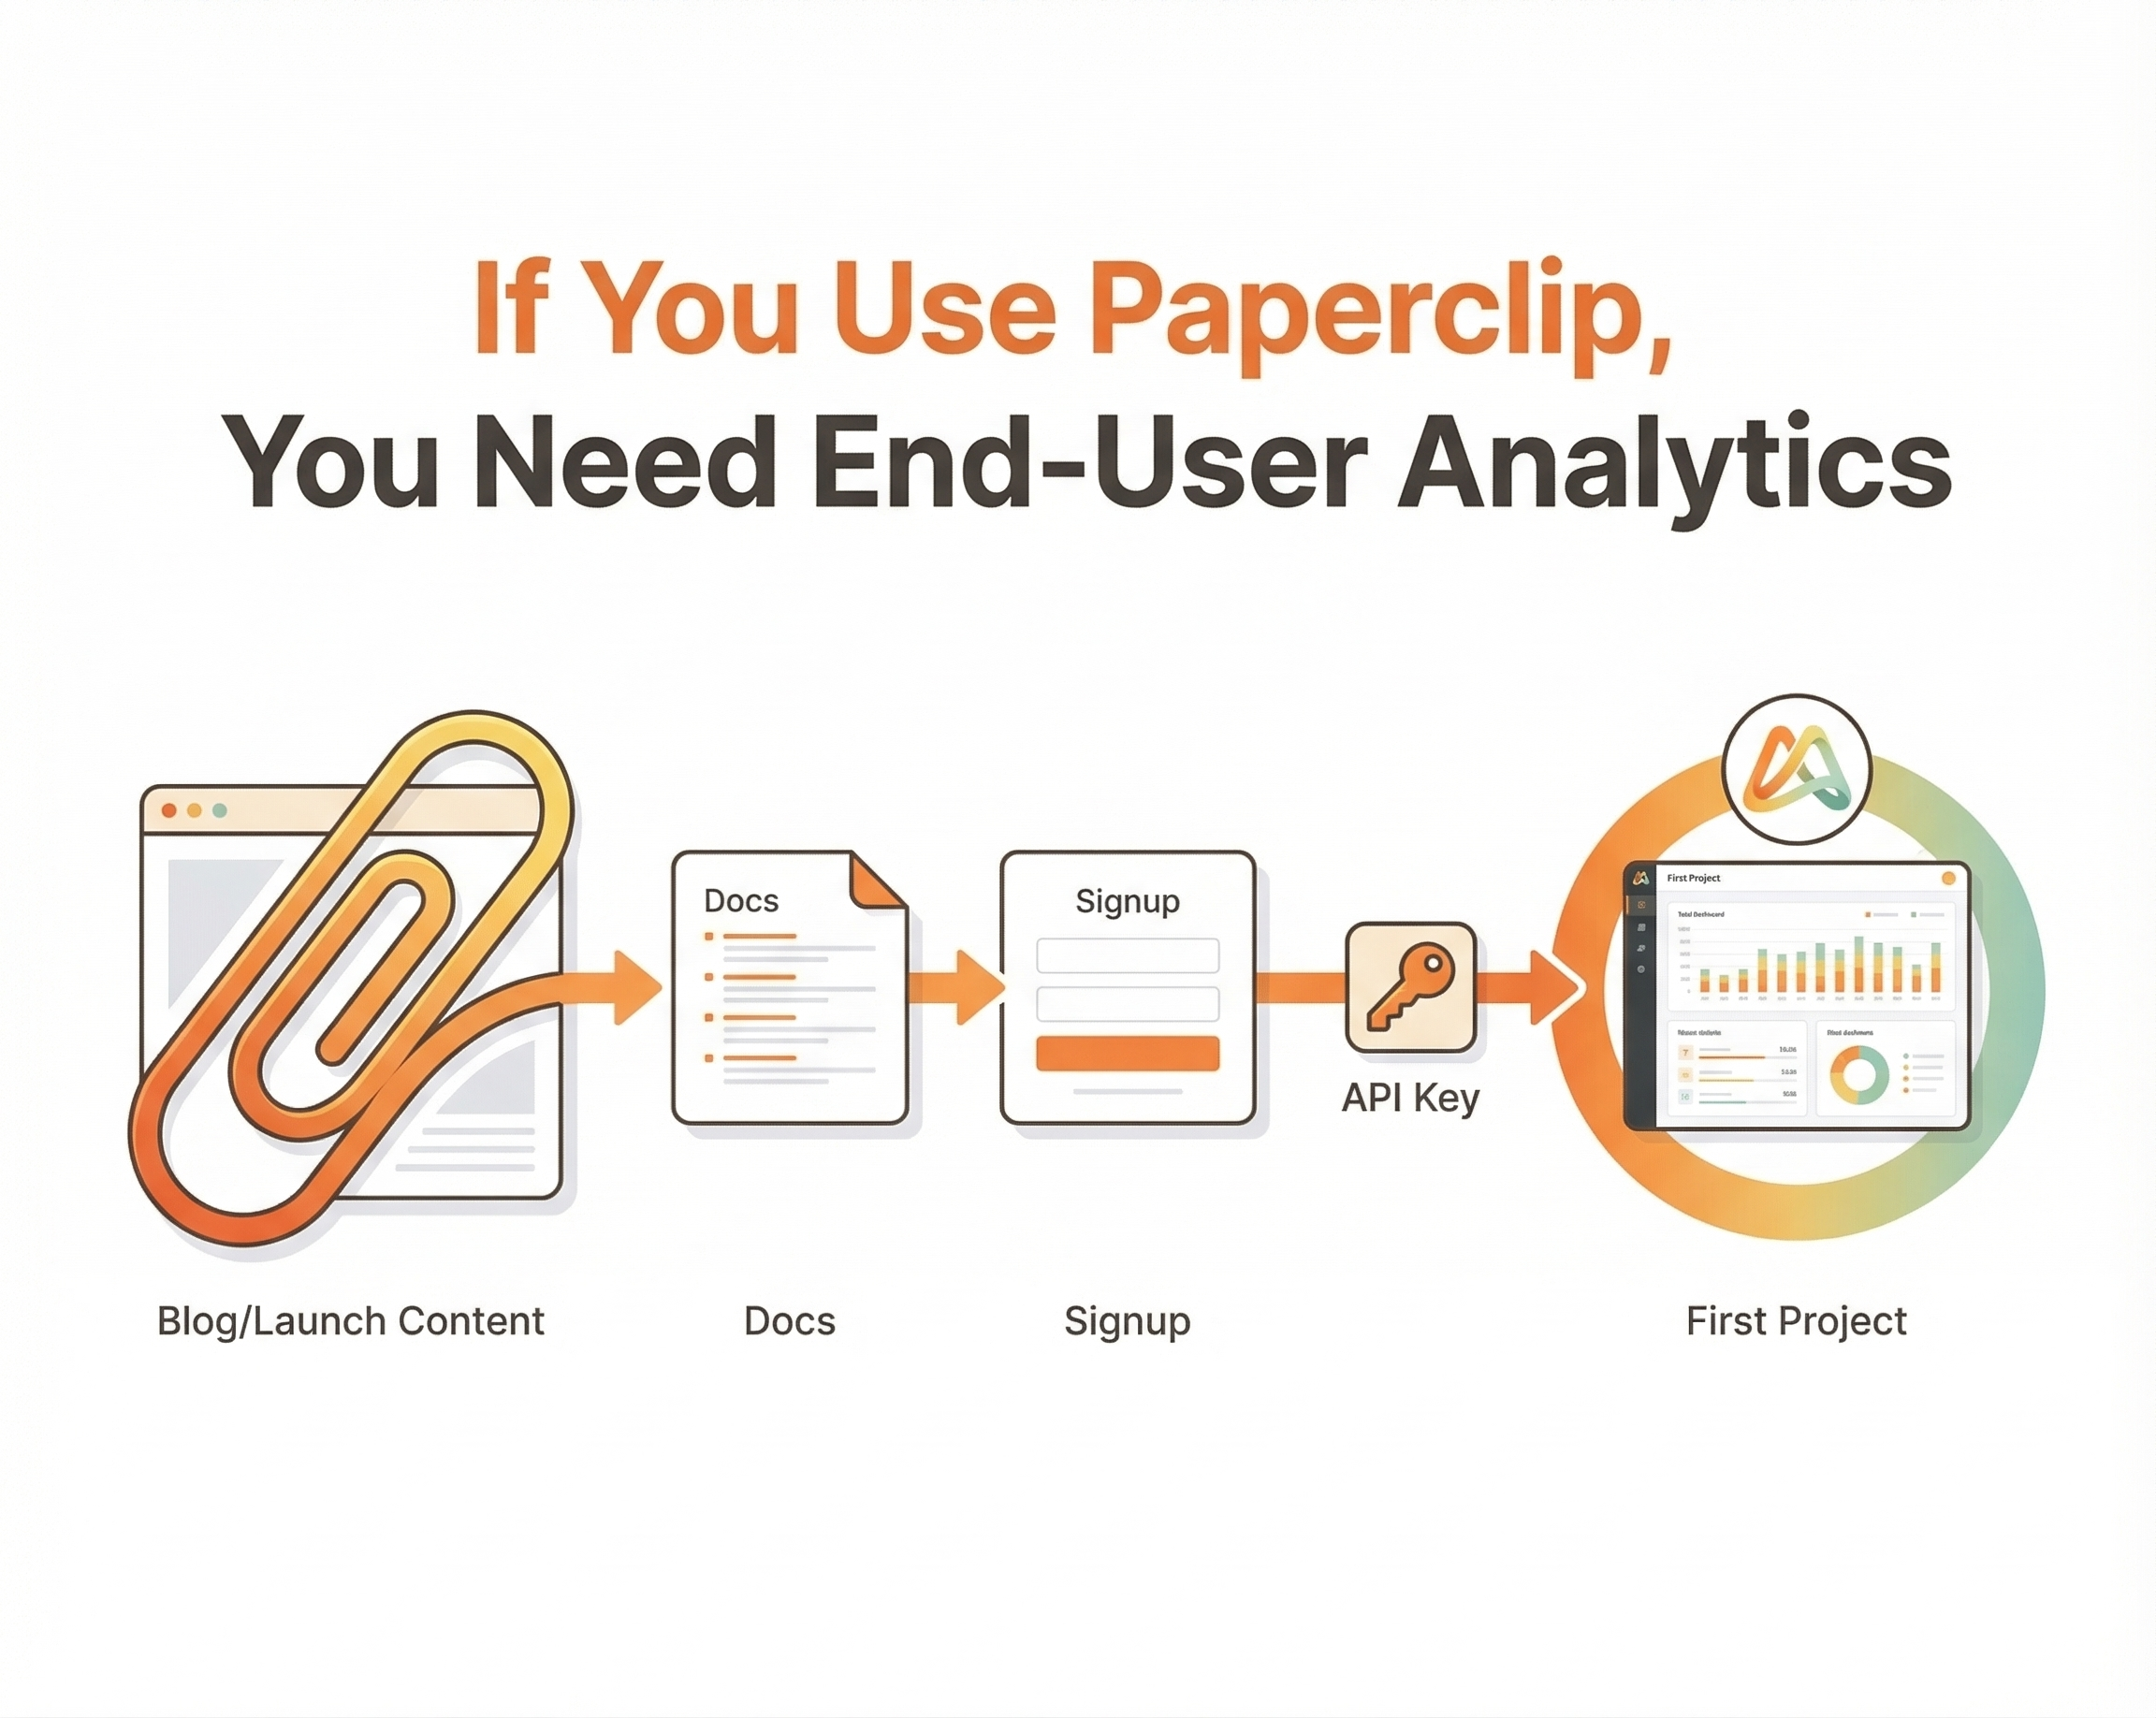
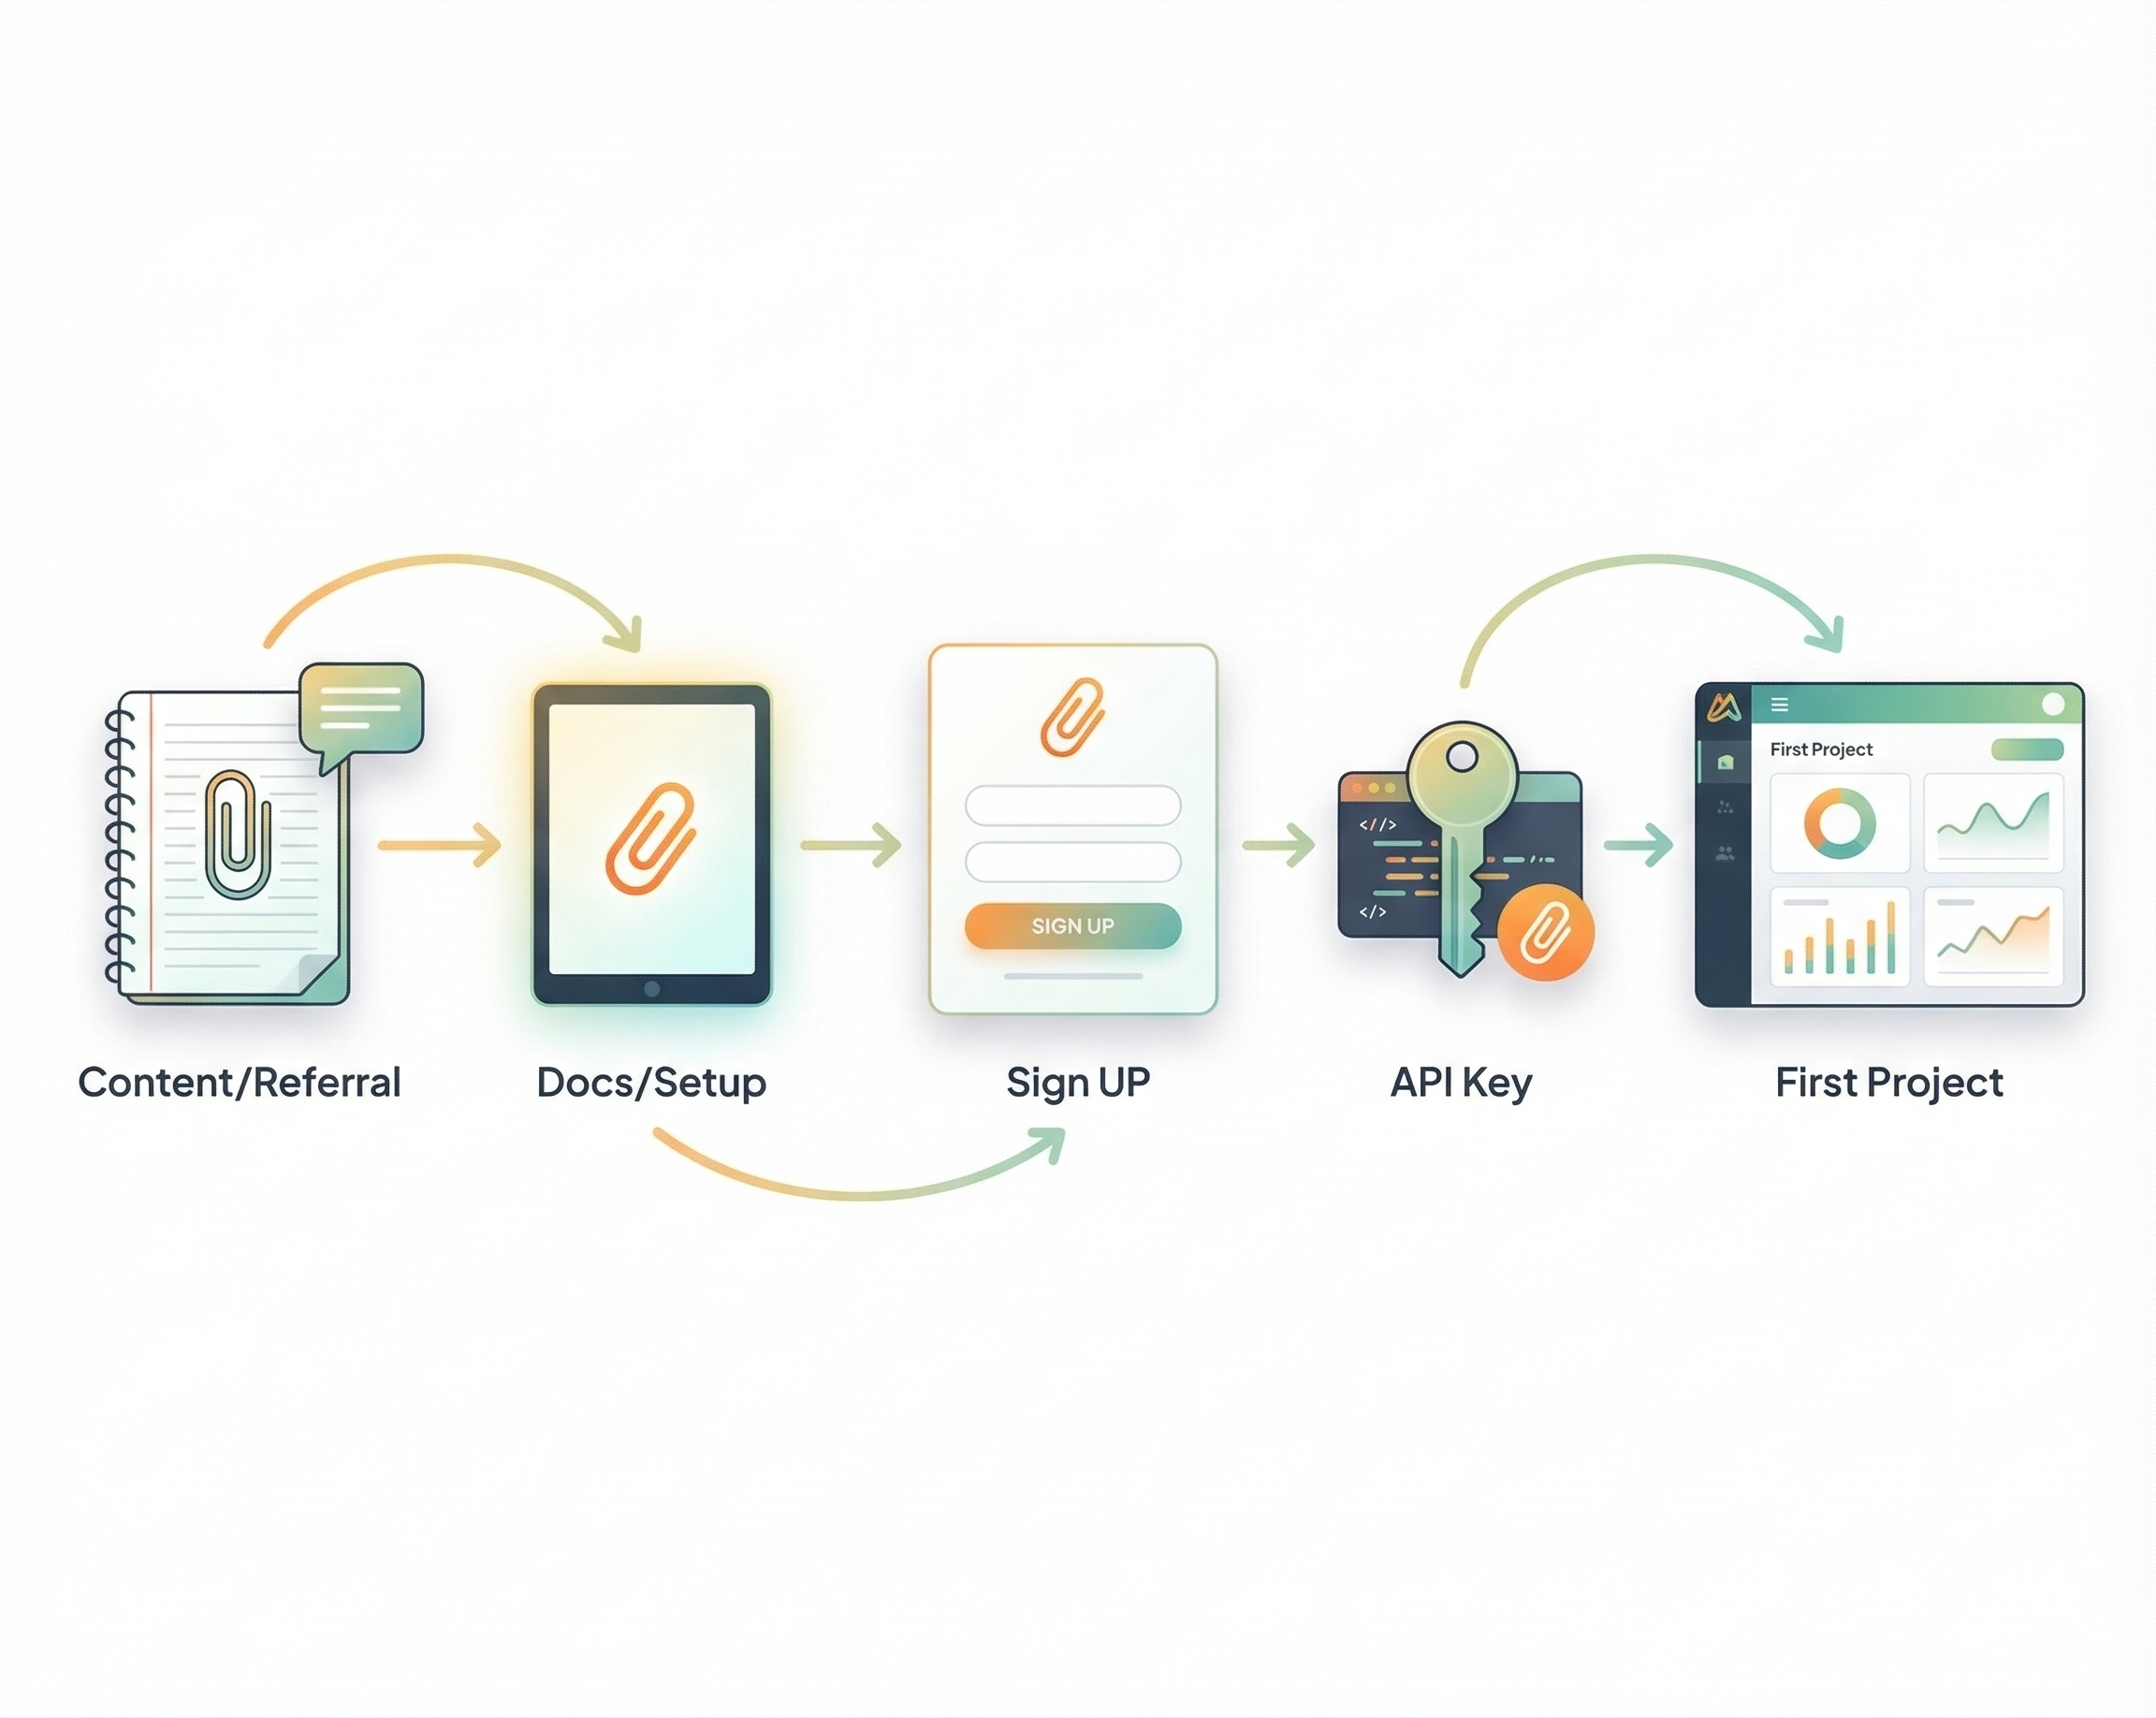
The first 📎Paperclip loop to measure is simple
For most 📎Paperclip companies, the first loop is simple:
- a post, launch message, or community link brings in a user
- that user lands on a docs or install page
- they decide whether setup looks real
- they sign up
- they generate an API key
- they create a first project
That is the real 📎Paperclip funnel.
It is one end-user journey.
Once you can see where users enter, where they hesitate, and where they drop off, the company can improve the journey with much more confidence.
Agent-readable analytics makes that path measurable.
You can see which post created qualified setup intent, which docs page drove install actions, which onboarding step leaked users, and which change improved first-project creation.
That is the difference between activity and progress.
📎Paperclip philosophy needs an agentic way to measure
📎Paperclip companies already have leverage on execution.
The next upgrade is connecting all that output to what users actually do.
With agent-readable analytics, the company can answer:
- which traffic source brings users who actually install?
- which docs flow produces signups instead of just pageviews?
- which onboarding change improves API key generation?
- which agent-made change increased first-project creation?
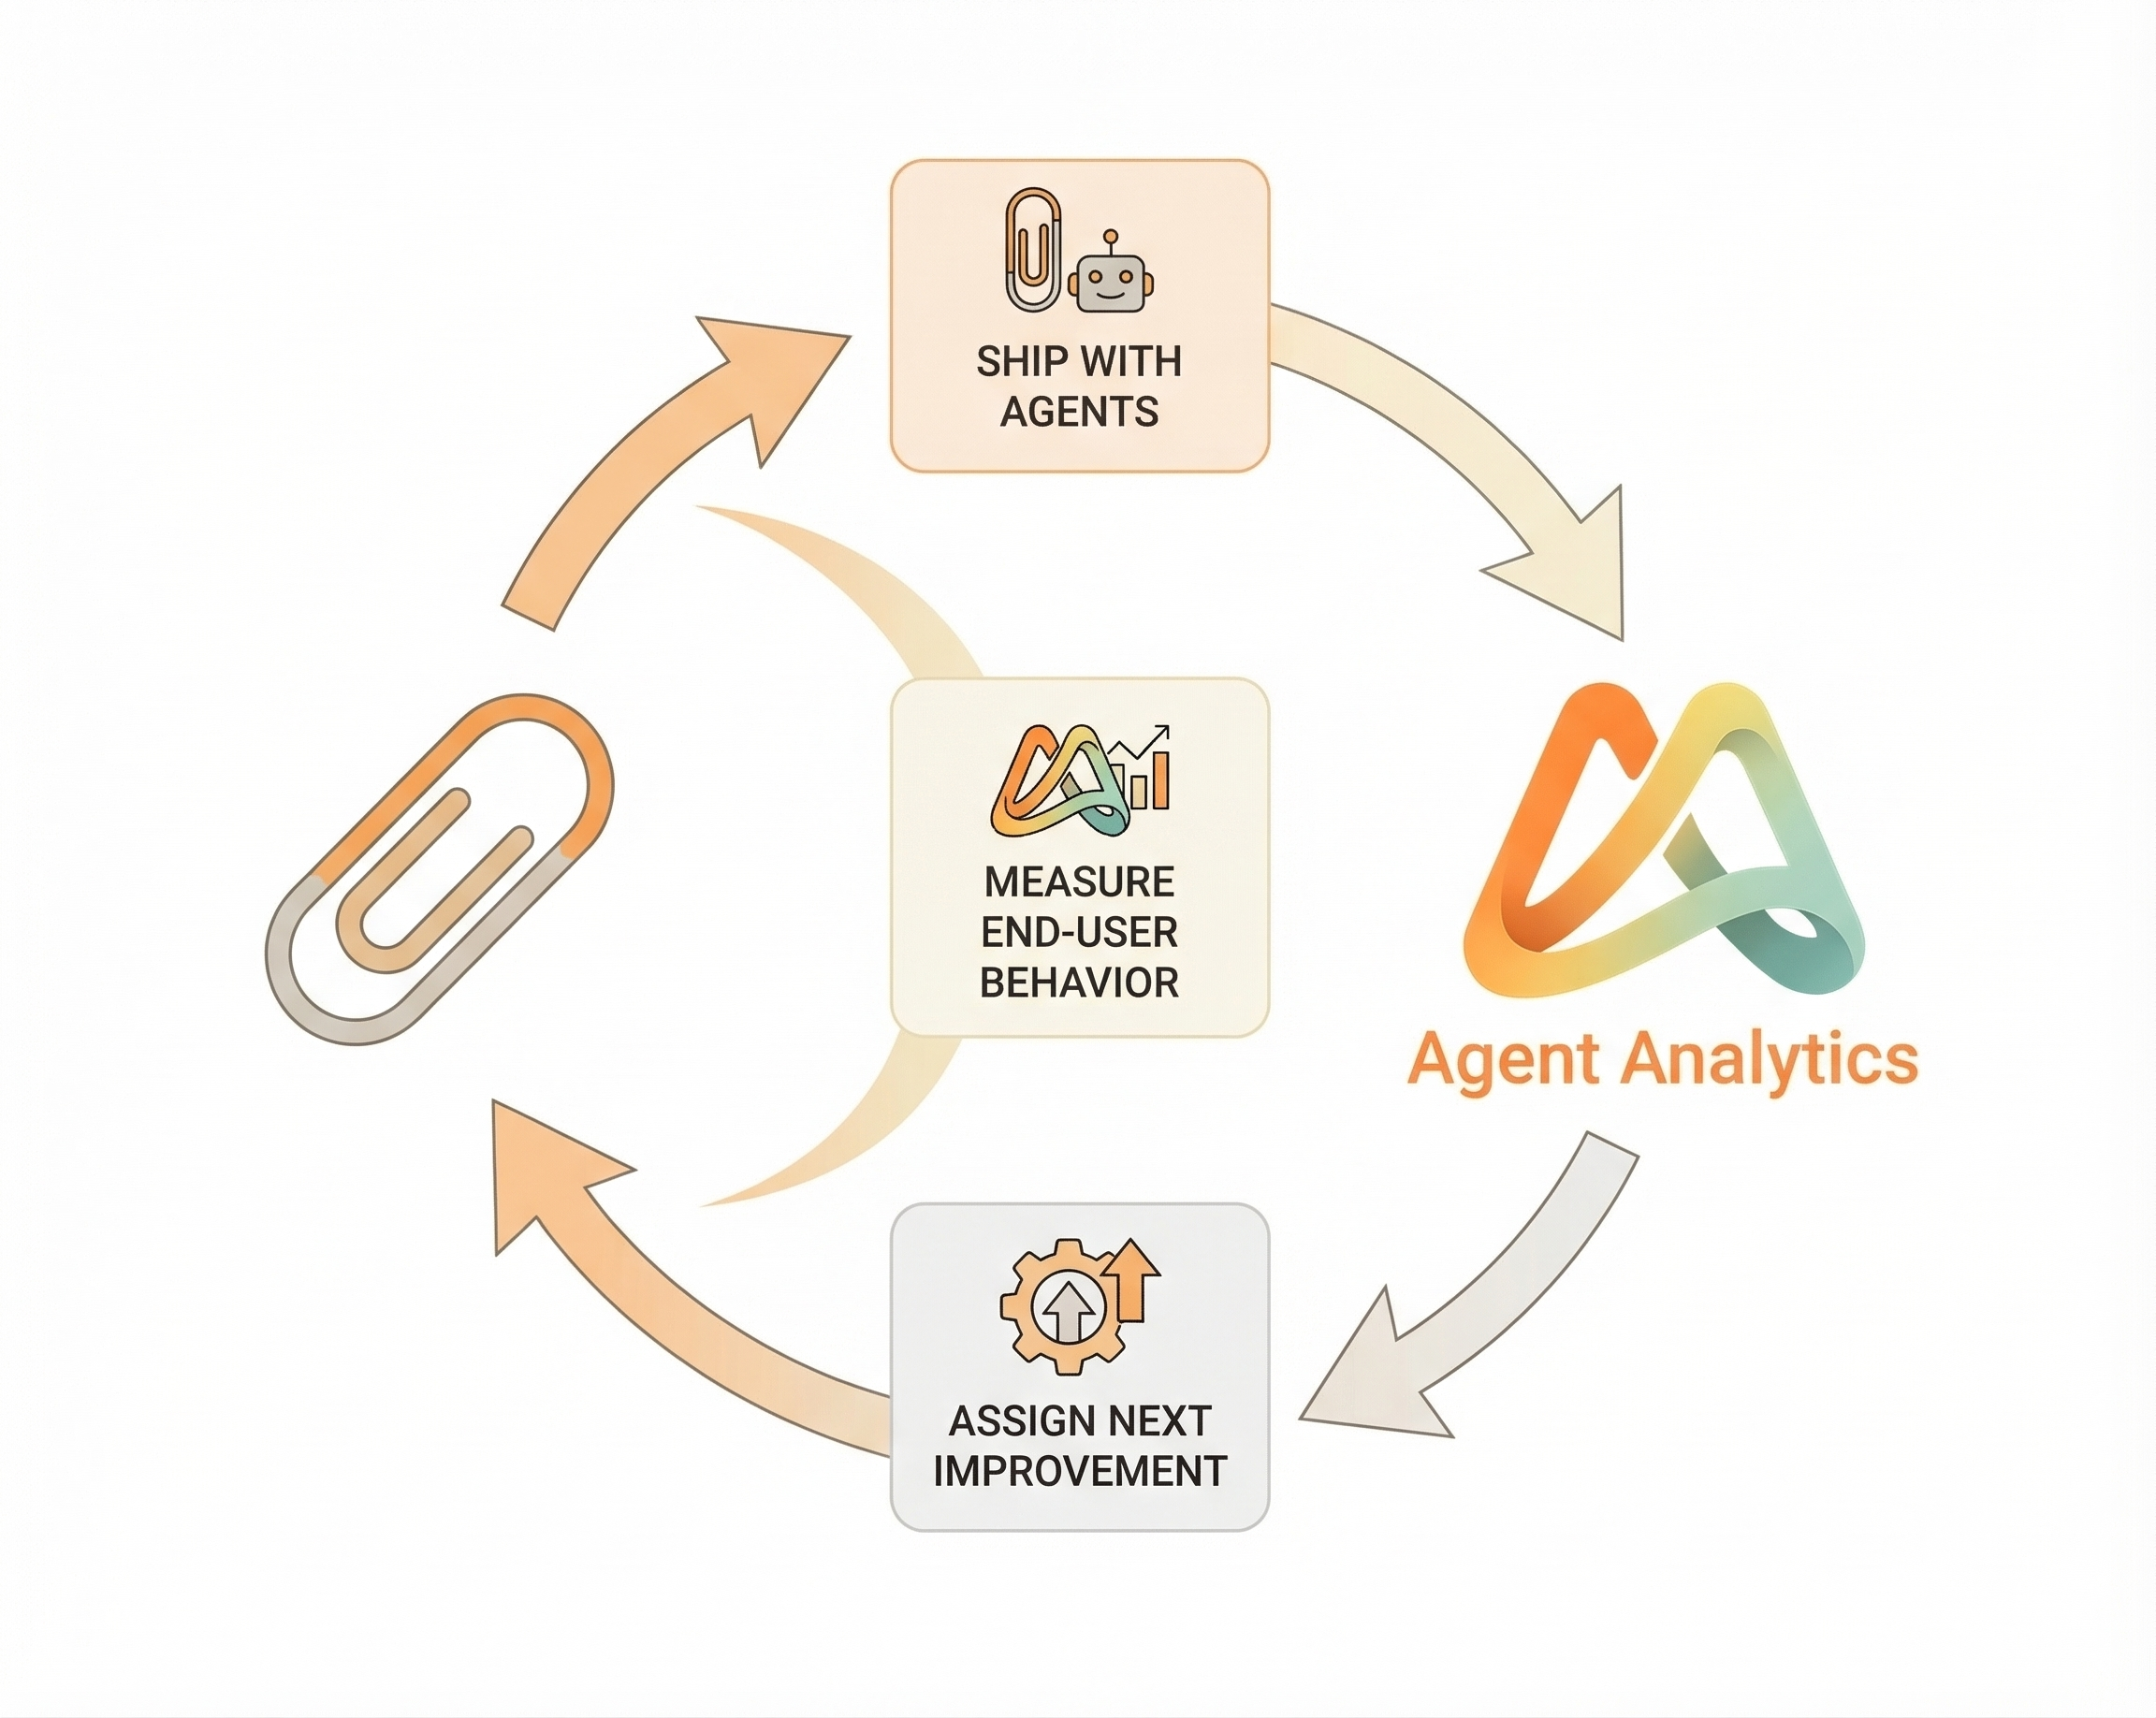
This is the operating upgrade.
📎Paperclip is built around delegation, ownership, and fast loops. Agent-readable analytics extends that loop from “task completed” to “user outcome measured” and then “next action assigned.”
That is where agent-readable analytics matters.
Once the data is queryable, the team gets better:
- your Content Strategist can judge a post by setup intent instead of impressions
- your Technical Writer can compare which install guide leads to more first projects
- your Analyst can spot where the user journey leaks and hand back the next fix
That is why the strongest 📎Paperclip setup pairs company execution with agent-readable analytics their agents can query and use.
Start here
If you want to put this in place today:
- Start with Set up Agent Analytics for your 📎Paperclip company if your company runs on 📎Paperclip
- Read Talk to Your Analytics for the query model your agents can use
If your company already runs on 📎Paperclip, the clean setup path is the CEO-owned setup flow in the Paperclip guide: Set up Agent Analytics for your 📎Paperclip company.
Add the live plugin when you want the map inside 📎Paperclip
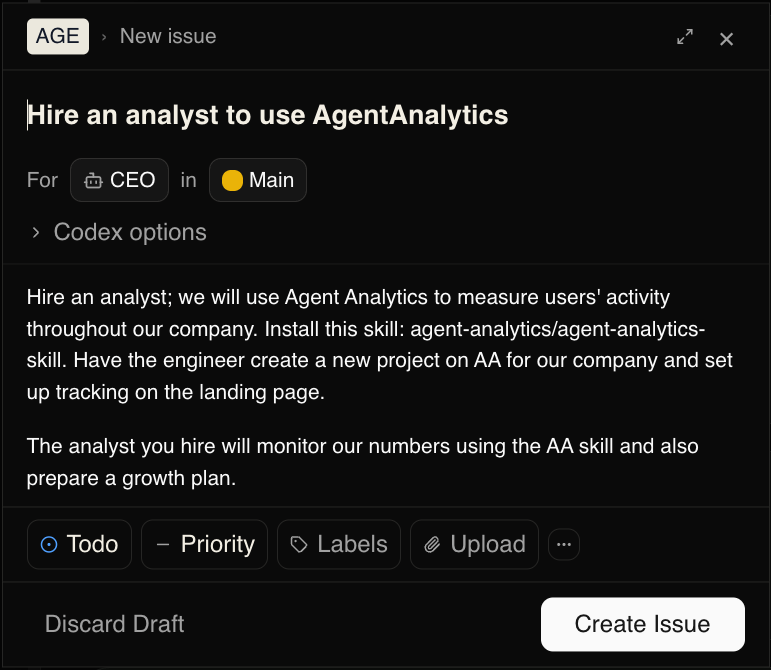
The first layer is still the analyst workflow:
- hire an analyst employee in 📎Paperclip
- install the Agent Analytics skill
- let that analyst query end-user behavior and prepare the next growth action
- give that analyst a recurring 8:00 AM job: query Agent Analytics for the latest 24 hours and post the brief back inside 📎Paperclip
But there is now a second layer too:
- install the Agent Analytics Live Paperclip plugin
- connect one Agent Analytics account
- select the project your 📎Paperclip company should monitor
- use the live map, dashboard widget, and plugin page to see what is moving now
That plugin is intentionally narrow.
It complements the analytics product and the analyst workflow.
It makes the current live pulse visible directly inside 📎Paperclip, so the company can see live visitors, active sessions, event flow, and geography without leaving the workspace.
📎Paperclip gives you execution leverage.
Agent-readable analytics tells you whether that execution helped a real user do anything that matters.
If you run on 📎Paperclip, this is the next obvious layer: measure the end-user journey, then let your agents improve it.
Related: Analytics Closes the Agent Feedback Loop · Talk to Your Analytics · 🦞 Set Up Agent Analytics with OpenClaw (5 Minutes)